X Analytics: The Four Numbers Worth Checking Weekly
Most X analytics advice lists every metric it can find. Here are the four I check each week, and the one I never read on its own.

X analytics shows you impressions, engagements, detail expands, profile visits, link clicks and media views. Open it daily and you start chasing whichever number moved last.
@MrB2Beast had about 100 followers at the start of October 2026. The X API reported 488 on 2026-10-19 and 531 on 2026-10-21. To learn what drives a curve like that, you read a few numbers the same way every week.
Key takeaways
- Post analytics only exist for your own posts. The full account dashboard has been a Premium feature since June 2024.
- Check four numbers weekly: new followers, profile visits against new followers, replies received and median views per post.
- An impression counts a screen appearance, not a person. Treat it as a warning light, not a score.
How to see analytics on X
There are two levels, and they are not the same product.
Post level. Open one of your own posts, open the menu and choose "View post analytics". You get impressions, engagements, detail expands, profile visits, link clicks and, on media posts, media views. The option only exists on posts you wrote.
Account level. The account dashboard sits at x.com/i/account_analytics, and the old analytics.x.com address redirects there. Since June 2024 the full account page is reserved for X Premium subscribers. It shows impressions, engagement rate, profile visits, video and link clicks with a date range you can change. X changes who gets what fairly often, so check your own app.
The X API exposes the same data. Public metrics like likes, replies, reposts, bookmarks and impressions work for any post. Private metrics like profile clicks and link clicks only work for your own posts created in the last 30 days. Save them or lose them.
What X analytics does, and what it does not do
X analytics tells you how a post was distributed and what people did with it. It does not tell you why, or whether the people who saw it were the ones you wanted.
That is the problem with impressions. X's own developer documentation counts an impression every time a post appears on a screen. It is not unique: one person who scrolls past your post twice counts twice.
Two creators in my X tips library make the same point from the other side: writing a post for a broader crowd brings more impressions early on, but not necessarily followers from your niche. Reach is the input. Followers and conversations are the output.
The four numbers worth checking weekly
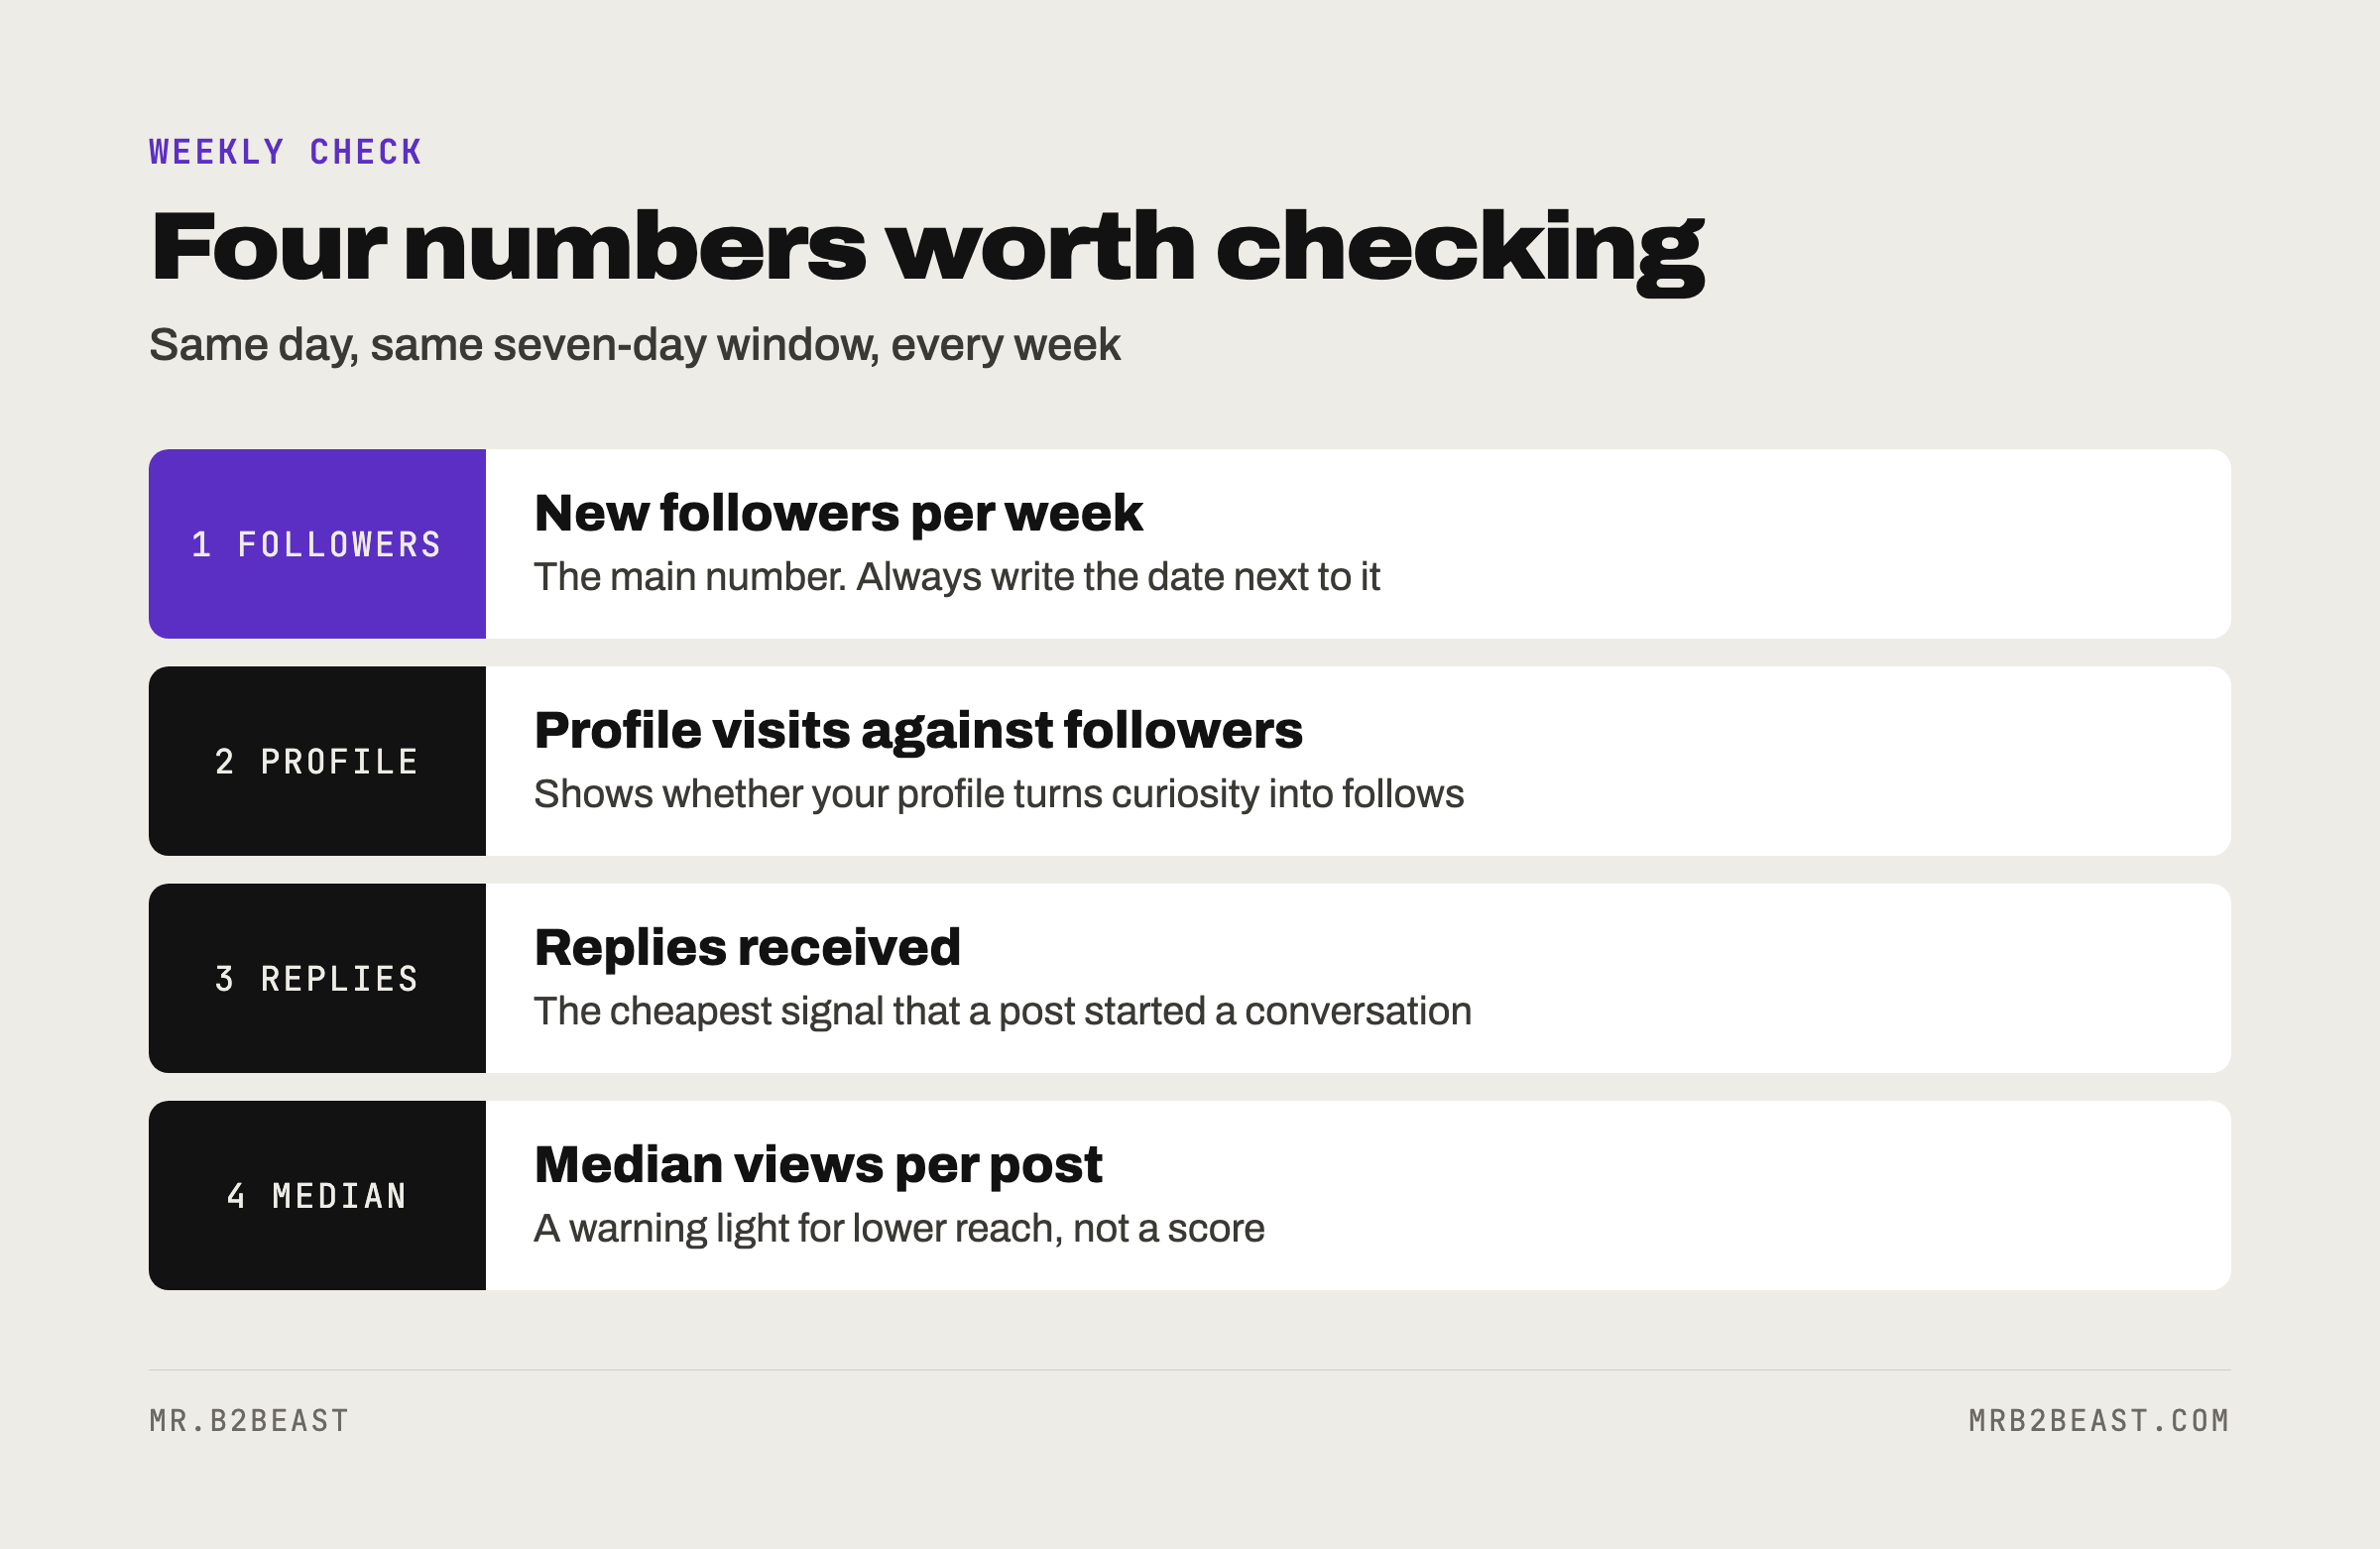
1. New followers per week
This is the main number. Everything else explains it. I take mine from the X API, because my follower check runs three times a week anyway.
Read it as a weekly net change against the week before, and always write the date next to a follower count. A follower count without a date is a rumor. My post counts are public on my stats page.
2. Profile visits against new followers
Profile visits show curiosity. New followers show that your profile closed the deal. One creator in my library tracks the ratio of new followers to profile visitors as a measure of profile conversion.
The ratio tells you where the leak is. Visits rise but followers do not: fix the profile, meaning bio, pinned post and header. Both stay flat: the posts are not pulling anyone in. If you are still at that stage, start with how to get followers on X.
3. Replies received
A reply is the cheapest signal that a post started a conversation. It shows up as reply_count in the public metrics. Count replies from other accounts, not your own answers.
On my account, answers to mentions run through the X API, capped at 20 a day, so replies get read daily anyway. The weekly count asks something else. Many replies and few new followers usually means good conversations with people who already follow you. Useful, but not growth.
4. Median views per post
Use the median, not the average. One outlier wrecks an average. One creator in my library saw a single post reach 2.4 million views on an account where posts usually got 50 to 100. The average for that month says nothing about a normal post. The median does.
If the median drops for two weeks in a row, check the boring causes first. My library lists three common triggers for lower reach: repetitive engagement spam, conflict or "BREAKING" style content, and NSFW material. Rule those out before you assume a shadowban. Timing can matter too, which is a topic for the best time to post on X.
The fifth number: newsletter signups per visitor
Followers on X are rented. Everything on my account leads to the newsletter, because it reaches people without a feed in between. One creator in my library claims only about 15 percent of followers see a given post on X, while a newsletter lands in every inbox. Treat that as one creator's experience, not a law.
The number that connects both is signups per site visitor. I only started measuring visitors on mrb2beast.com on 2026-10-20, so I will not quote a rate until at least two full weeks sit behind it. A rate from three days of data is noise with a percent sign.
How I run the weekly X analytics check
Five steps, once a week.
- Same day, same window. Pick one day and always compare the last seven days to the seven before.
- Save the raw numbers. Private metrics disappear from the API after 30 days, so copy them into a sheet or a file.
- Wait for the data to settle. According to X's help pages, metrics can take up to 36 hours to stabilize. Do not judge yesterday's post today.
- Write one sentence per number. What moved, and your best guess why.
- Change one thing. One format, one hook style, one posting time. Two changes at once and you learn nothing.
Study the posts with the most profile visits first. For threads, read the profile visits, not the impressions of post one. How to build those is in how to write a thread.
Why isn't X analytics working?
Three causes cover most cases.
- It is not your post. The analytics option only appears on posts you wrote.
- You are on the free plan. The full account dashboard requires Premium.
- The data is fresh, or the account is flagged. Numbers can need up to 36 hours to settle. X's help pages also say an empty post activity dashboard likely means the account was found in violation of its rules.
FAQ
How do I see analytics on X? For a single post, open one of your own posts, open the menu and choose "View post analytics". For the whole account, go to x.com/i/account_analytics. The full account dashboard requires X Premium.
Is X analytics free? Post analytics on your own posts have been available without a subscription, though X changes access often. The full account analytics page has been reserved for X Premium subscribers since June 2024. The X API limits private metrics to your own posts from the last 30 days.
Which X analytics numbers matter most? New followers per week, because everything else explains them. Add profile visits against new followers, replies received and median views per post. Impressions alone count screen appearances, not people.
How often should I check Twitter analytics? Once a week is enough for most accounts. Daily checks make you react to noise, and recent numbers can take up to 36 hours to settle.
About the author
Tristan Eilenburg. One person. AI systems. Global reach. I write about building systems that work, with evidence instead of hype.
- X: @MrB2Beast
- LinkedIn: Tristan Eilenburg
- Instagram: @mrb2beast
The newsletter goes out once a week. If this one taught you something, the newsletter is where the next one lands first. The X tips behind this article are free in the X tips cheat sheet.
Sources
- X Developer Platform (2026). Metrics. https://docs.x.com/x-api/fundamentals/metrics
- Petryshyn, V. (2026, September 9). How to See Your Impressions on X (Twitter). Postory. https://postory.io/blog/how-to-see-impressions-on-x
- Social Samosa (2024, June 14). X unveils advanced analytics for its premium subscribers. https://www.socialsamosa.com/news-2/x-advanced-analytics-premium-subscribers-4760985