Your Worst Case Is Still Too Optimistic. How to Beat the Planning Fallacy
Why padding your plan does not work, and what the research says you should do instead.

In 1994, psychologists asked 37 honors students how long their thesis would take. Their best guess was 33.9 days on average. Then they were asked for a worst case, assuming everything went badly. That answer was 48.6 days.
The theses took 55.5 days on average. Fewer than half of the students finished by their own worst case.
That is the planning fallacy, measured by Roger Buehler, Dale Griffin and Michael Ross. Most advice about it says: be more pessimistic, add a buffer. The students did exactly that. It was not enough.
The advice is not stupid. It is just aimed at the wrong lever. Pessimism changes the mood of a plan. It does not change the information the plan is built on.
I want to show you why even a worst case is built on the wrong data. I want to show you the small experiment, buried in the same paper, that points to the fix. And I want to give you a planning routine you can run this week, for your next quarter.
Key takeaways
- In the classic thesis study, the average student took longer than their own average worst-case estimate.
- Simply remembering past projects barely helped. Explicitly linking past results to the new plan doubled on-time finishes.
- The fix is the outside view: plan from how similar projects actually went, not from how this one should go.
What the research actually shows
The common belief is that we underestimate time because we are lazy planners. Add more detail, think harder, and the estimate improves.
The research says something more uncomfortable. Detailed thinking is part of the problem.
What is the planning fallacy? The planning fallacy is the tendency to underestimate how long a task will take, even when you know similar tasks ran late before. Daniel Kahneman and Amos Tversky named it in 1979. The key part is the second half: people know their track record and still predict that this time will be different.
The thesis study, read closely
The headline numbers from Study 1 travel well. The details travel less. Only 29.7 percent of the students finished by their best guess. Only 48.7 percent finished by their worst case. And 10.8 percent finished by their best case.
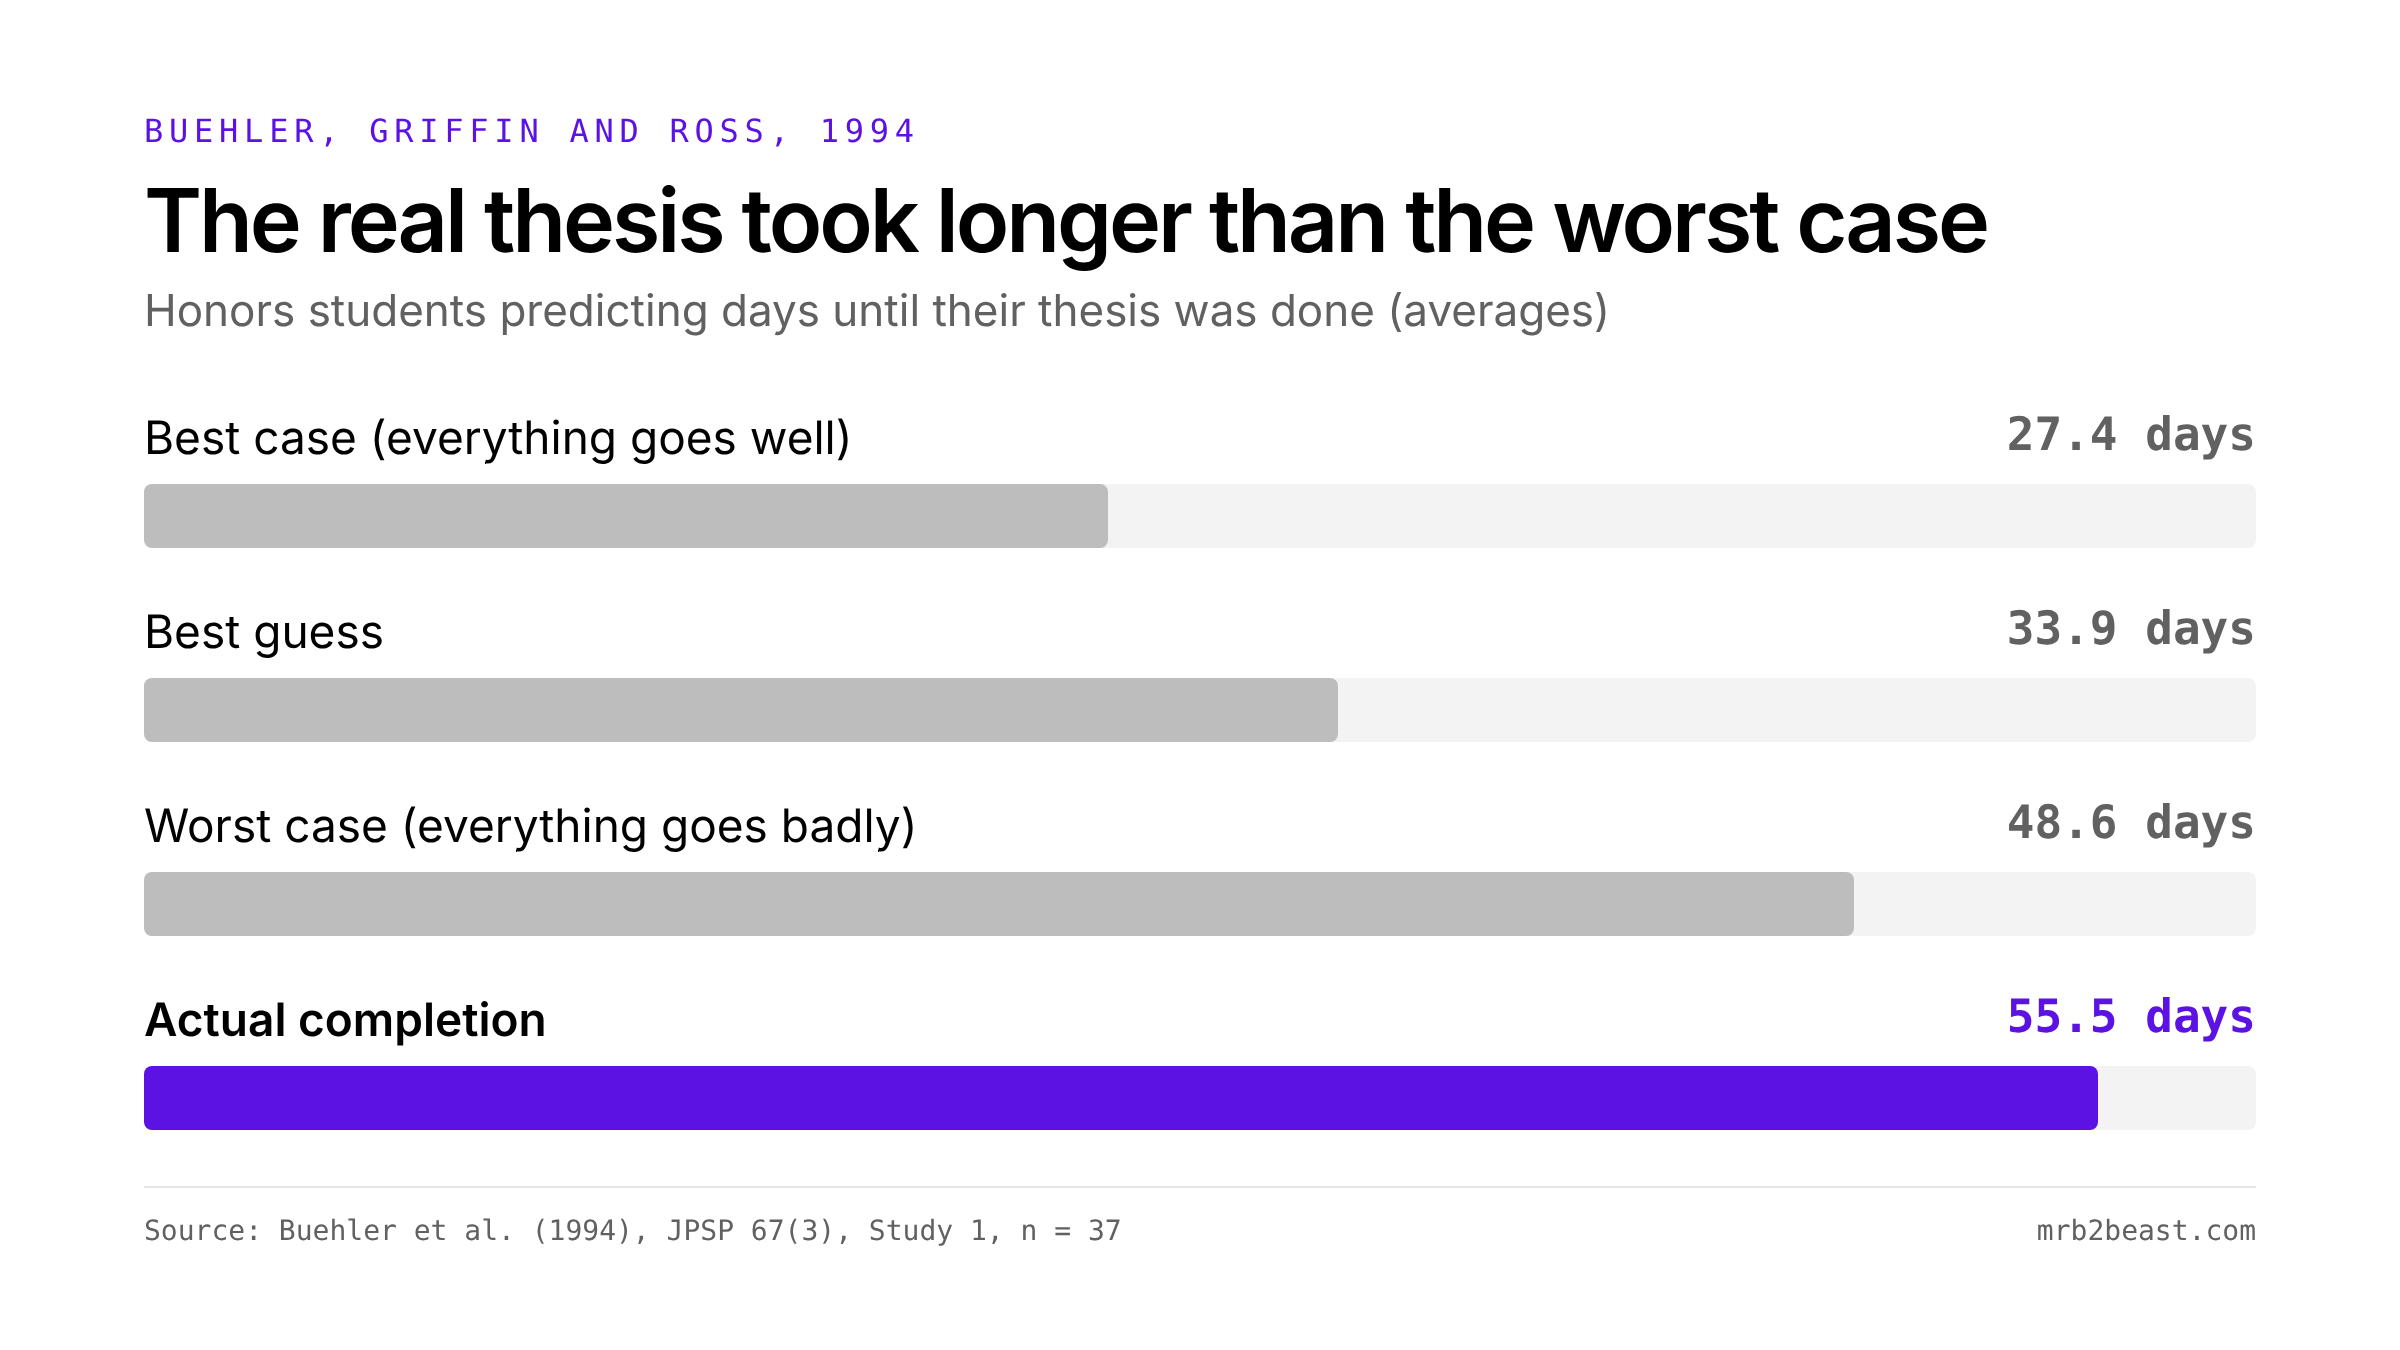
Look at the gap between the bars. The worst case moved the estimate up by about 15 days. Reality moved it up by about 22. The students were not careless. They simply imagined a bad version of their own plan, and reality was worse than that.
What people think about while planning
In Study 3, the researchers asked students to think aloud while predicting a project. Then they coded every thought.
On average, 74 percent of thoughts were about future scenarios. Only 7 percent were about relevant past experiences. And only 3 percent concerned possible obstacles. Most of the thinking was a story about how the project would go.
Here is the twist. The same students said they usually finished projects only about a day before the deadline. They knew their history. They just did not use it.
When asked why past projects ran late, they blamed causes that were external, short-lived and specific. A flu. A family visit. Bad luck. Each delay looked like an exception, so none of them counted as data.
The experiment nobody quotes
Study 4 is where the paper turns useful. Students predicted how long a computer tutorial assignment would take. They were split into three groups.
The control group simply predicted. The recall group first described how long similar past assignments had taken. The recall-relevant group did the same, and then had to write down how their past experience applied to this new prediction.
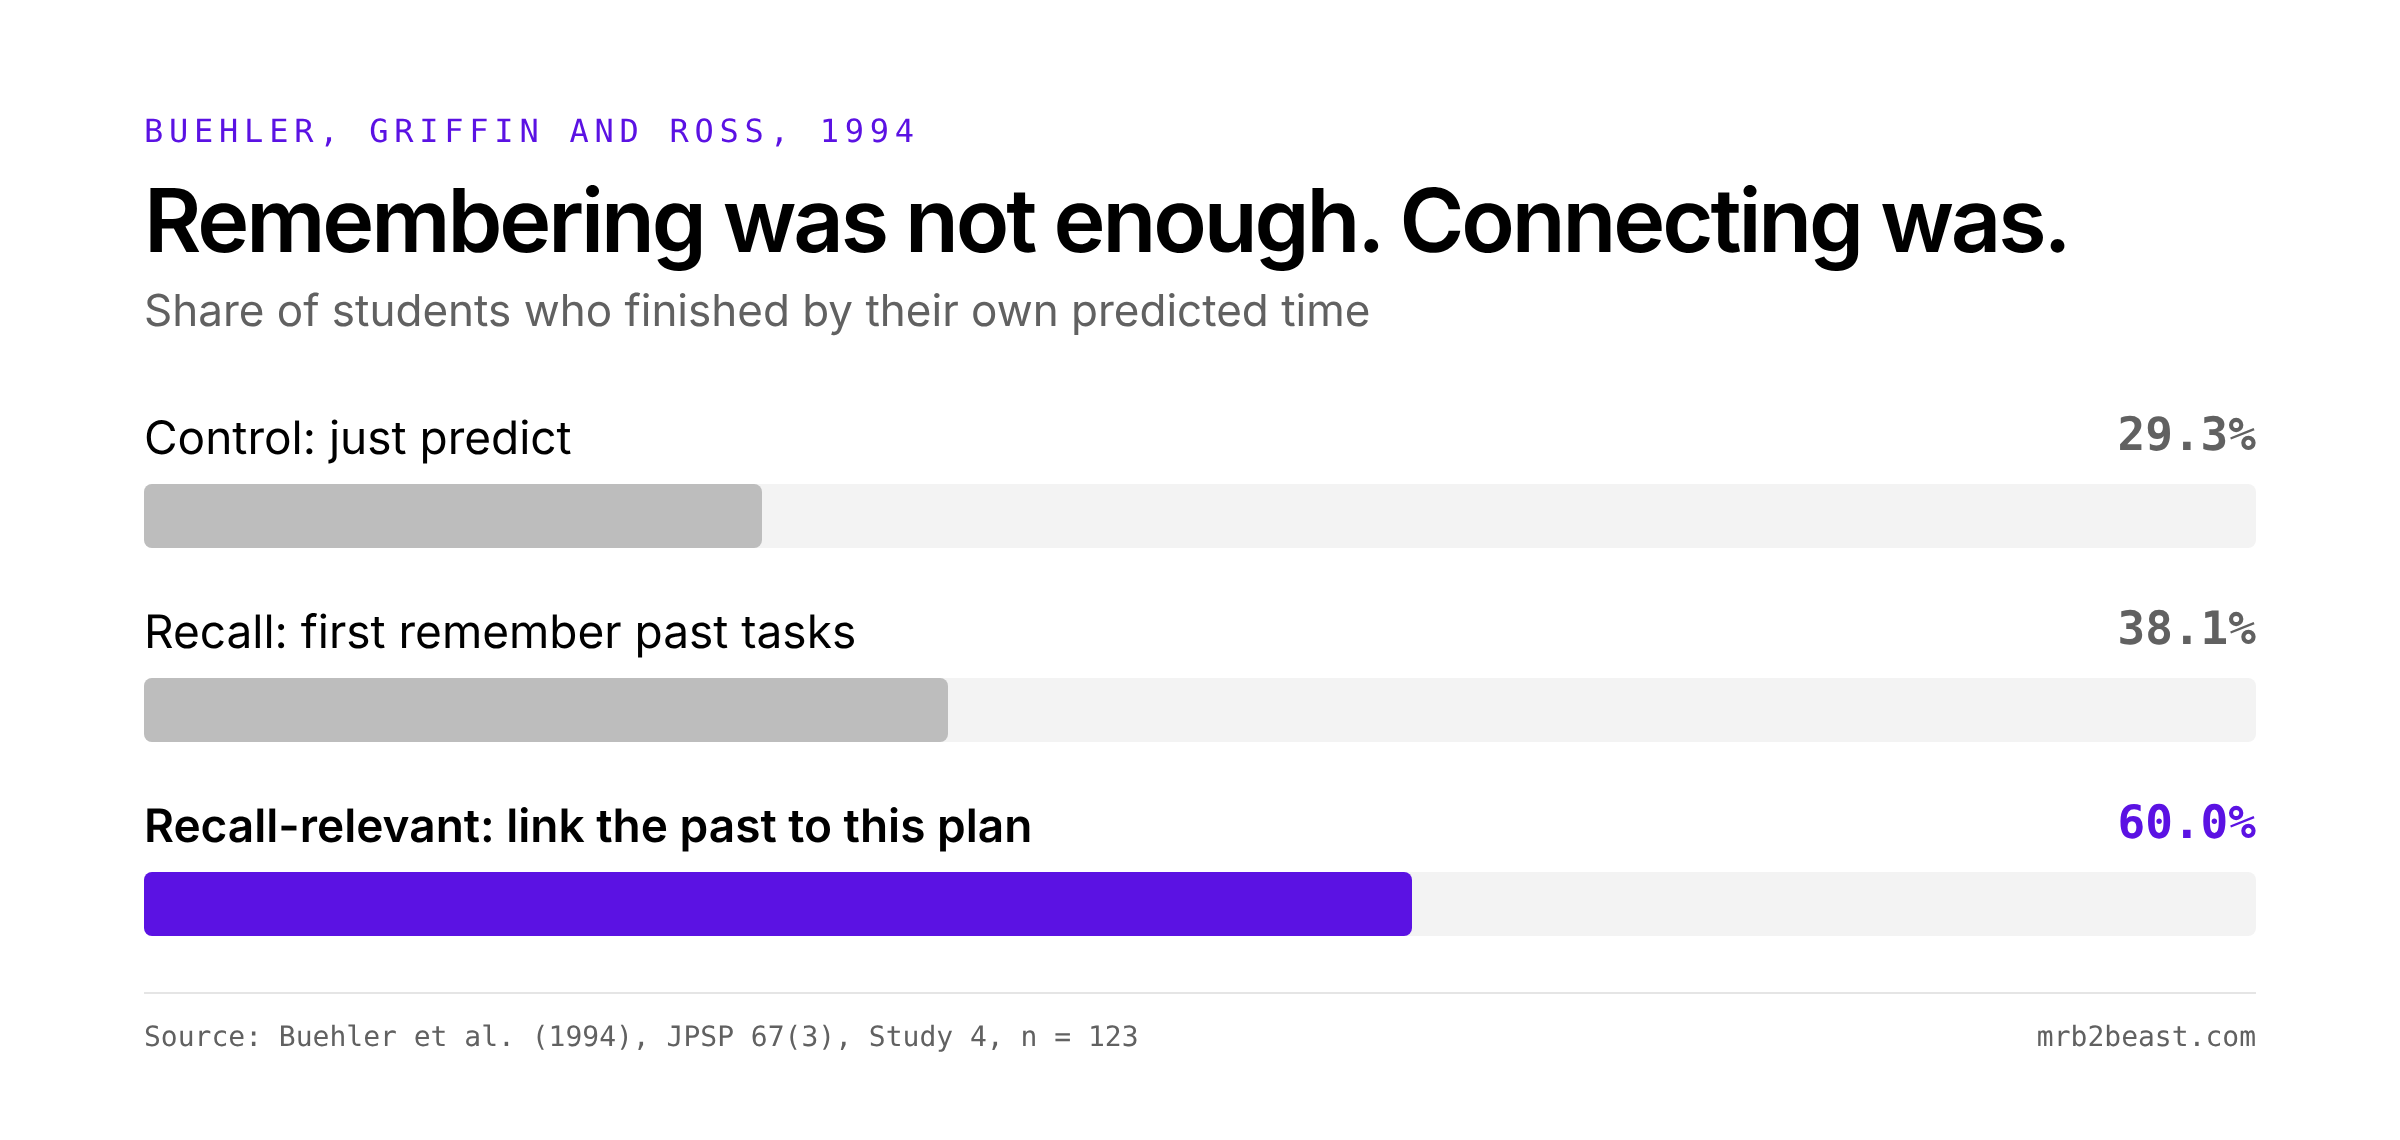
Recall alone barely moved the result. In the recall-relevant group, 60.0 percent finished by their own predicted time. Their average prediction and their average actual time were both 7.0 days. The optimistic bias was gone.
In short: the planning fallacy is not a lack of pessimism. It is a lack of connection between your track record and your next plan.
Why projects take longer than expected: three mistakes
The same pattern shows up far outside student theses. Once you know it, it is easy to spot.
Mistake 1: Trusting the inside view because it feels detailed
Daniel Kahneman describes a curriculum project in Israel in his book Thinking, Fast and Slow. His team estimated they would finish a textbook in one and a half to two and a half years.
He then asked Seymour Fox, an expert in curriculum development on the team, how long comparable teams had taken. Fox thought about it. About 40 percent never finished. The rest took seven to ten years. Compared with those teams, Fox said, their own team was below average, "but not by much."
Fox had given an estimate in that same two-year range himself, minutes earlier. The data had been in his head the whole time. The team discussed it briefly and carried on. The book took eight years, and it was never used.
What is the inside view? The inside view is a forecast built from the details of your own project: the plan, the steps, the people. The outside view ignores those details first and asks how a class of similar projects actually turned out. Kahneman calls the inside view the natural default, which is why it needs a deliberate counterweight.
Mistake 2: Treating every overrun as bad luck
The Sydney Opera House is the classic planning fallacy example. According to the National Museum of Australia, it was budgeted at 7 million dollars and planned for completion in December 1963. It opened on 20 October 1973 and cost 102 million dollars.
Bent Flyvbjerg lists the overrun as 1,400 percent. The exact figure from those two numbers is about 1,357 percent, as the NSW Treasury states. Either way, it is more than 14 times the first budget, and ten years late.
Every big project has its own story of why it was different. That is the problem. In "How Big Things Get Done", Flyvbjerg and Dan Gardner report on a database of more than 16,000 projects. Only 8.5 percent came in on budget and on time. Only 0.5 percent hit budget, time and promised benefits.
At that rate, a delay is not bad luck. It is the base rate.
Mistake 3: Padding the plan instead of changing the input
Here is an example. A solo founder plans a new course launch for the quarter. The detailed plan says six weeks. She knows she runs late, so she adds two weeks of buffer.
Her last four launches each took roughly twice as long as planned. Her buffer is a feeling. Her track record is a number. She used the feeling.
That is exactly what the thesis students did with their worst case. The buffer came from the same inside story, just told in a darker tone.
How to beat the planning fallacy: the Outside-In Quarter
The method professionals use is called reference class forecasting. Flyvbjerg describes it in three steps. Find a reference class of similar past projects. Establish how their outcomes were distributed. Then place your project in that distribution. It was first used in practice in 2004, for a tram line in Edinburgh.
You do not need a database of 16,000 projects. You need your own. Here is a version for a quarter.
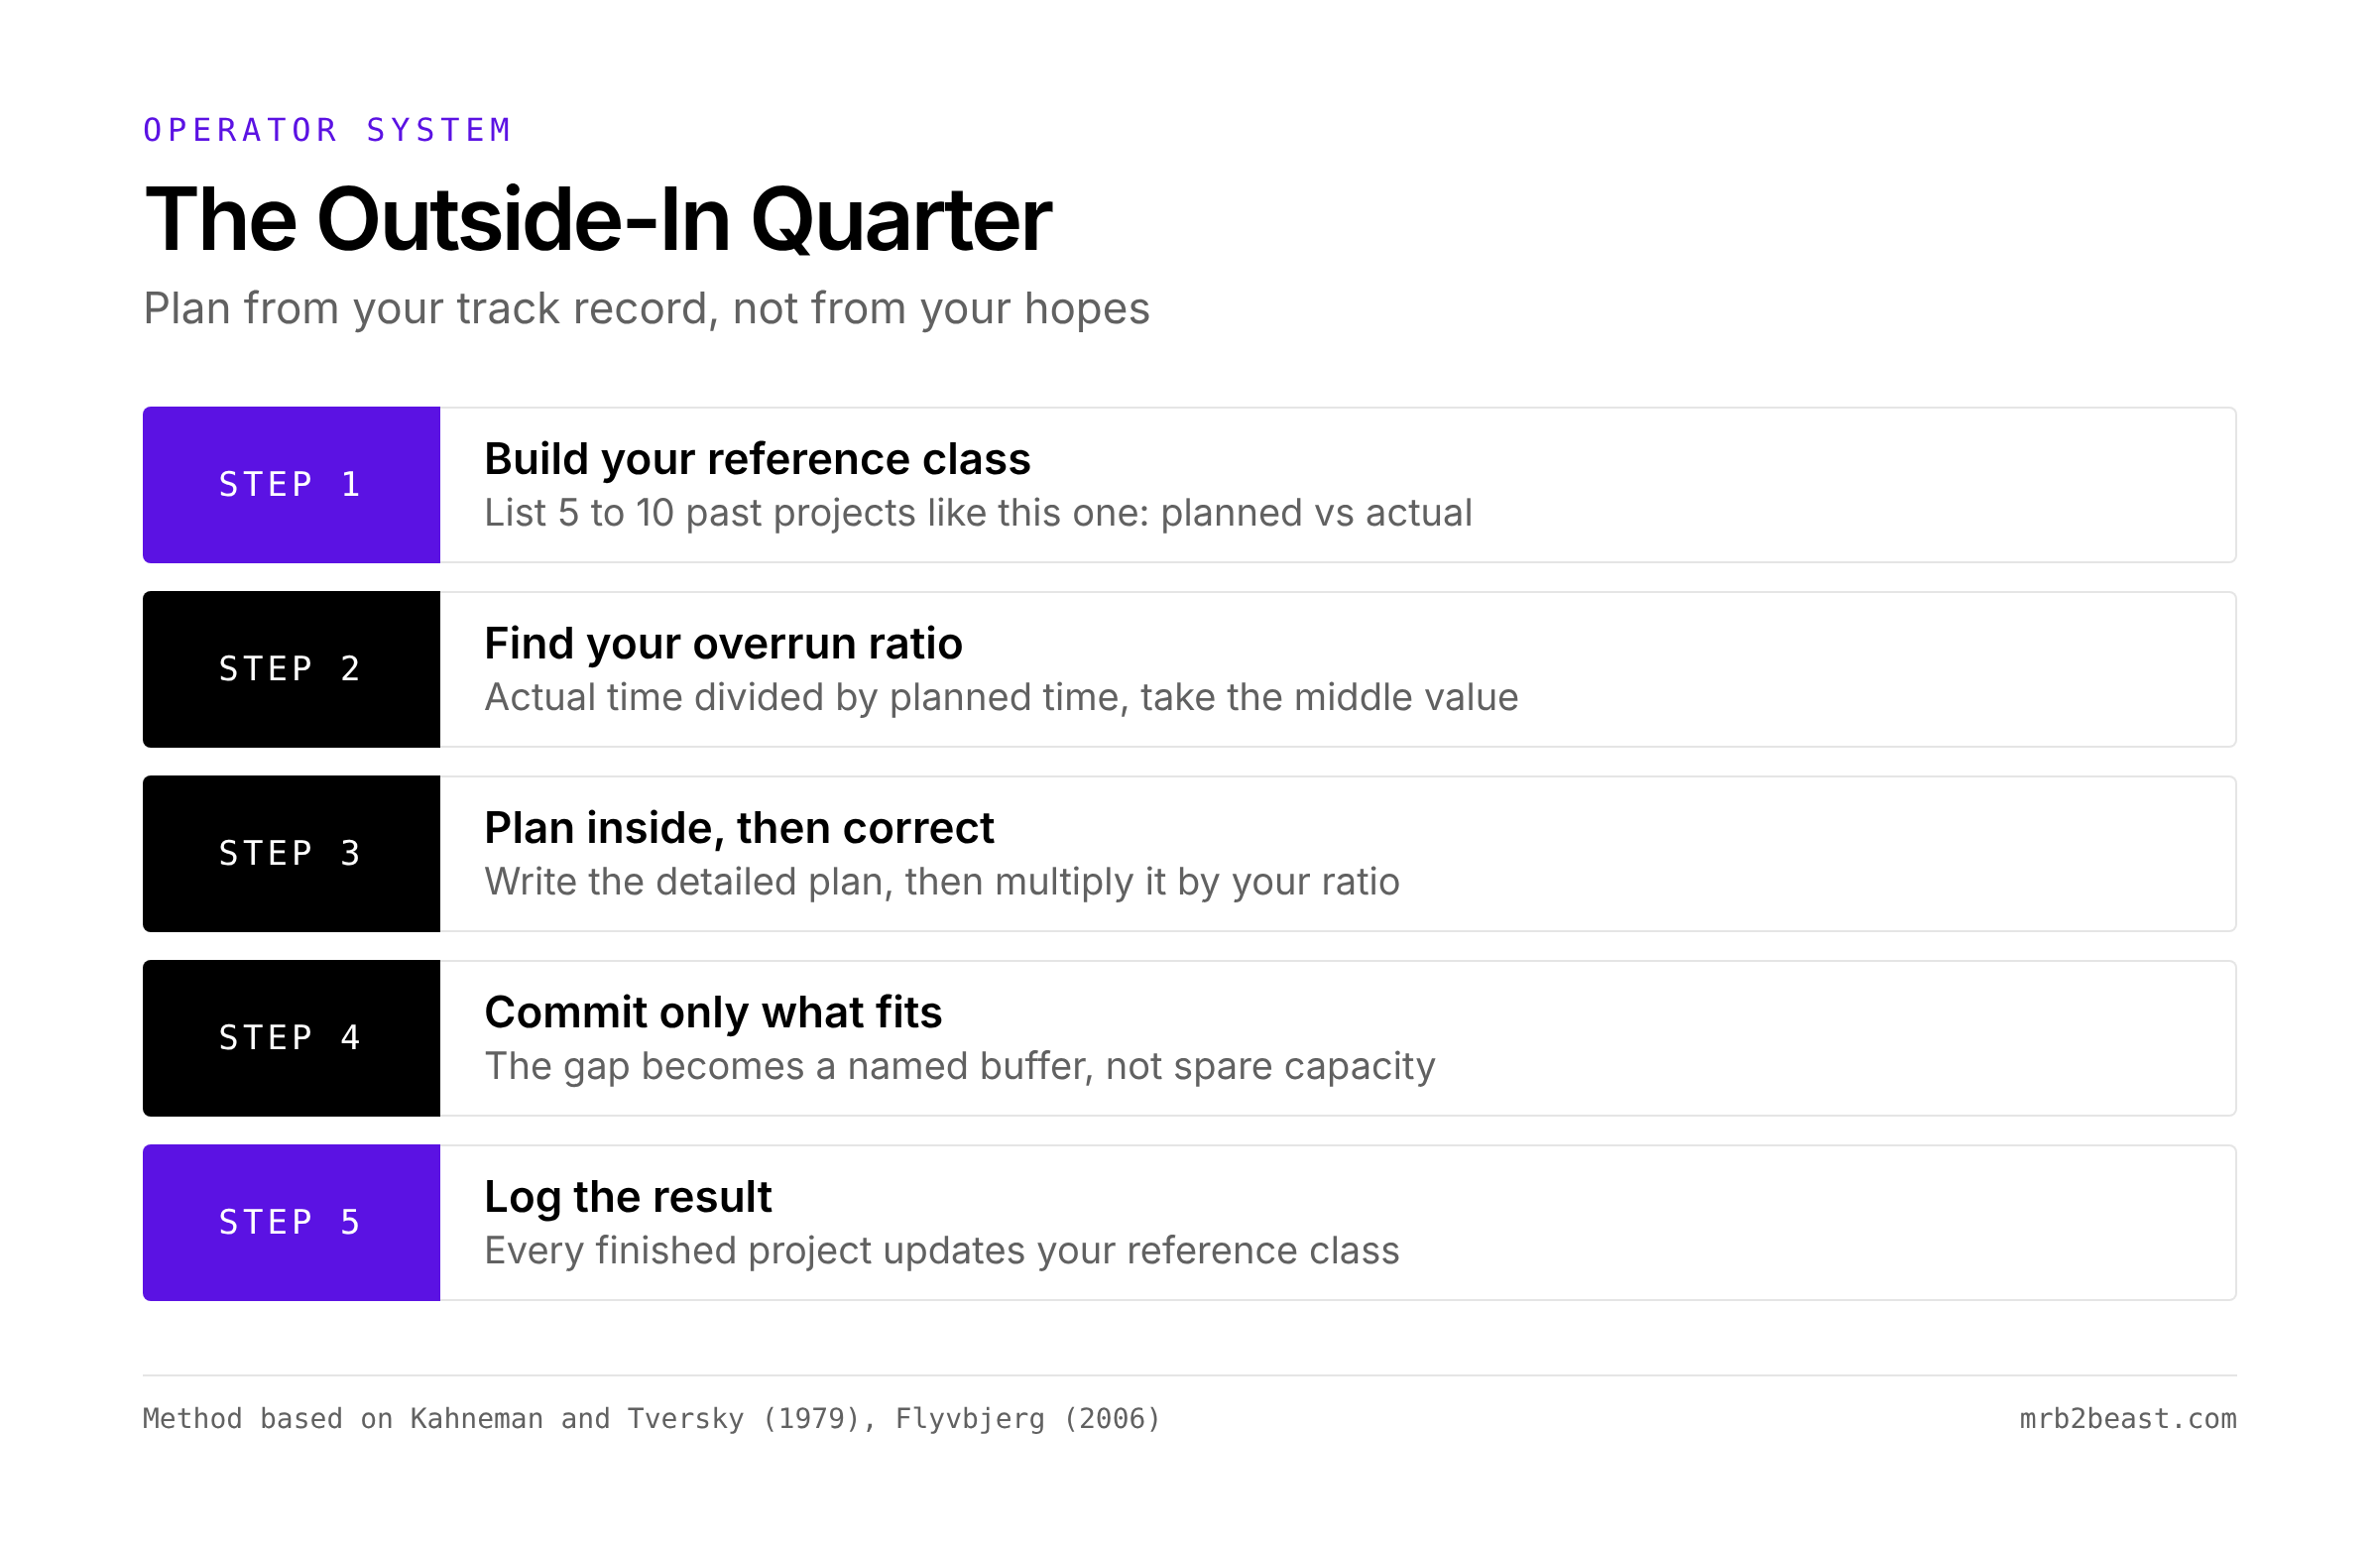
Step 1: Build your reference class. Before you plan anything, list 5 to 10 past projects similar to the one ahead. A launch, a hire, a website rebuild. For each one, write two numbers: planned time and actual time. Rough is fine.
Step 2: Find your overrun ratio. Divide actual by planned for each project. Take the middle value, not the best one. The thesis students would have had a ratio of about 1.6. The Kahneman team, using the data Fox had in his head, would have had at least 3.
Step 3: Plan inside, then correct. Now write the detailed plan as usual. Then multiply the total by your ratio. This is the Study 4 move: you write down how your past applies to this specific plan. If the result feels too long, that feeling is the planning fallacy talking.
Step 4: Commit only what fits. Fill the quarter with the corrected estimates, not the raw ones. Whatever no longer fits is moved to next quarter by decision, not by drift. The gap between plan and correction becomes a named buffer, reserved for the project that caused it.
Step 5: Log the result. At the end of the quarter, add every finished project to your list with planned and actual time. Your reference class grows, and your ratio gets more honest every quarter.
This loop is the idea behind Gaapp.io, a quarterly goal planning app that connects yearly goals to daily steps and shows what is due today. Disclosure: I am building it. A paper notebook works too. What matters is that the planned and actual numbers live in the same place.
If you want the bigger chain from yearly goal to daily step, the article on how to achieve goals covers it.
Ask yourself this week:
- How long did my last three similar projects take, compared with what I planned?
- Is my current buffer based on a number or on a feeling?
- What would I drop from this quarter if every project took my real ratio?
Conclusion: plan from the record, not the story
Your worst case is a darker version of your plan. Your track record is the plan reality already wrote.
The planning fallacy does not go away with experience. Kahneman studied judgment for a living and still needed eight years for a two-year book. The fix is not more pessimism. It is a different input.
Look at how similar things went. Write down how that applies here. Then plan the quarter around the corrected number.
What you learned today
- In the 1994 thesis study, the average student took 55.5 days, longer than the average worst case of 48.6 days.
- Remembering past projects barely helped. Linking past results to the new plan raised on-time finishes from 29.3 to 60.0 percent.
- Reference class forecasting turns your own history into a correction factor. Use it before you commit to a quarter.
FAQ
What is the planning fallacy? The planning fallacy is the tendency to underestimate how long a task will take, even when similar tasks ran late before. Kahneman and Tversky named it in 1979. In a 1994 study, students took 55.5 days on average to finish a thesis they expected to finish in 33.9 days.
What are some planning fallacy examples? The Sydney Opera House was budgeted at 7 million dollars for completion in 1963 and opened in 1973 at 102 million. The textbook team of Daniel Kahneman expected about two years and needed eight. In daily life, it shows up in thesis deadlines, product launches and home renovations.
Why do projects take longer than expected? People plan from the inside view: the steps of this specific project. They rarely use their track record, and they explain past delays as one-off bad luck. In one study, only 7 percent of planning thoughts were about relevant past experiences, and only 3 percent were about possible obstacles.
What is reference class forecasting? Reference class forecasting predicts a project by looking at how similar past projects turned out. You choose a reference class, look at the distribution of its outcomes, and place your project in it. Bent Flyvbjerg developed it for practice, based on the outside view described by Kahneman and Tversky.
How do you estimate time more accurately? List similar past tasks with planned and actual time. Calculate your typical overrun ratio. Make your detailed plan, then multiply it by that ratio. Write down how your past applies to this task. Afterwards, log the real time, so the next estimate starts from better data.
About the author
Tristan Eilenburg. One person. AI systems. Global reach. I write about building systems that work, with evidence instead of hype.
- X: @MrB2Beast
- LinkedIn: Tristan Eilenburg
- Instagram: @mrb2beast
- Building Gaapp.io (Instagram: @gaapp.io)
I write one of these every week. If this one taught you something, the newsletter is where the next one lands first.
Sources
- Buehler, R., Griffin, D., and Ross, M. (1994). Exploring the "planning fallacy": Why people underestimate their task completion times. Journal of Personality and Social Psychology, 67(3), 366-381. https://doi.org/10.1037/0022-3514.67.3.366 (PDF: https://bear.warrington.ufl.edu/brenner/mar7588/Papers/buehler-et-al-1994.pdf)
- Kahneman, D., and Tversky, A. (1979). Intuitive prediction: Biases and corrective procedures. TIMS Studies in Management Science, 12, 313-327.
- Kahneman, D. (2011, November 1). Daniel Kahneman: Beware the "inside view". McKinsey Quarterly, excerpt from Thinking, Fast and Slow. https://www.mckinsey.com/capabilities/strategy-and-corporate-finance/our-insights/daniel-kahneman-beware-the-inside-view
- Flyvbjerg, B. (2006). From Nobel Prize to project management: Getting risks right. Project Management Journal, 37(3), 5-15. https://arxiv.org/abs/1302.3642
- Flyvbjerg, B. (2014). What you should know about megaprojects and why: An overview. Project Management Journal, 45(2), 6-19. https://doi.org/10.1002/pmj.21409 (preprint: https://arxiv.org/abs/1409.0003)
- Flyvbjerg, B., and Gardner, D. (2023). How Big Things Get Done. Currency. Figures as summarized in: Lipford, J. W. (2023). Review of How Big Things Get Done. The Independent Review, 28(2). https://www.independent.org/tir/2023-fall/how-big-things-get-done/
- National Museum of Australia. Defining Moments: Sydney Opera House. https://www.nma.gov.au/defining-moments/resources/sydney-opera-house
- NSW Treasury. The House the Lotteries Built. https://www.nsw.gov.au/departments-and-agencies/nsw-treasury/about-us/nsw-treasury-bicentenary/walking-a-tightrope/moments/house-lotteries-built